Many of you, like me, probably woke up the past few mornings to some crazy air-quality number. I read something that said parts of northern MN registered for “worst in the world” yesterday.
The Minnesota Pollution Control Agency (MPCA) has most of the state under an air quality alert running through this morning. Minneapolis, where I live, was sitting in the purple category most of yesterday. You may be asking what that means and what you should do.
And for those not in the Midwest… roughly 17 lightning-caused fires are burning across the Boundary Waters Canoe Area Wilderness in northern Minnesota, an estimated 55,000 acres as of Thursday night.
Let’s explore it all.
The air quality index (AQI).
AQI is the EPA’s way of taking a bunch of pollutant measurements and boiling them down to one number between 0 and 500, color-coded, so you can get a sense of the health of the outdoor air.
The scale breaks into six categories:
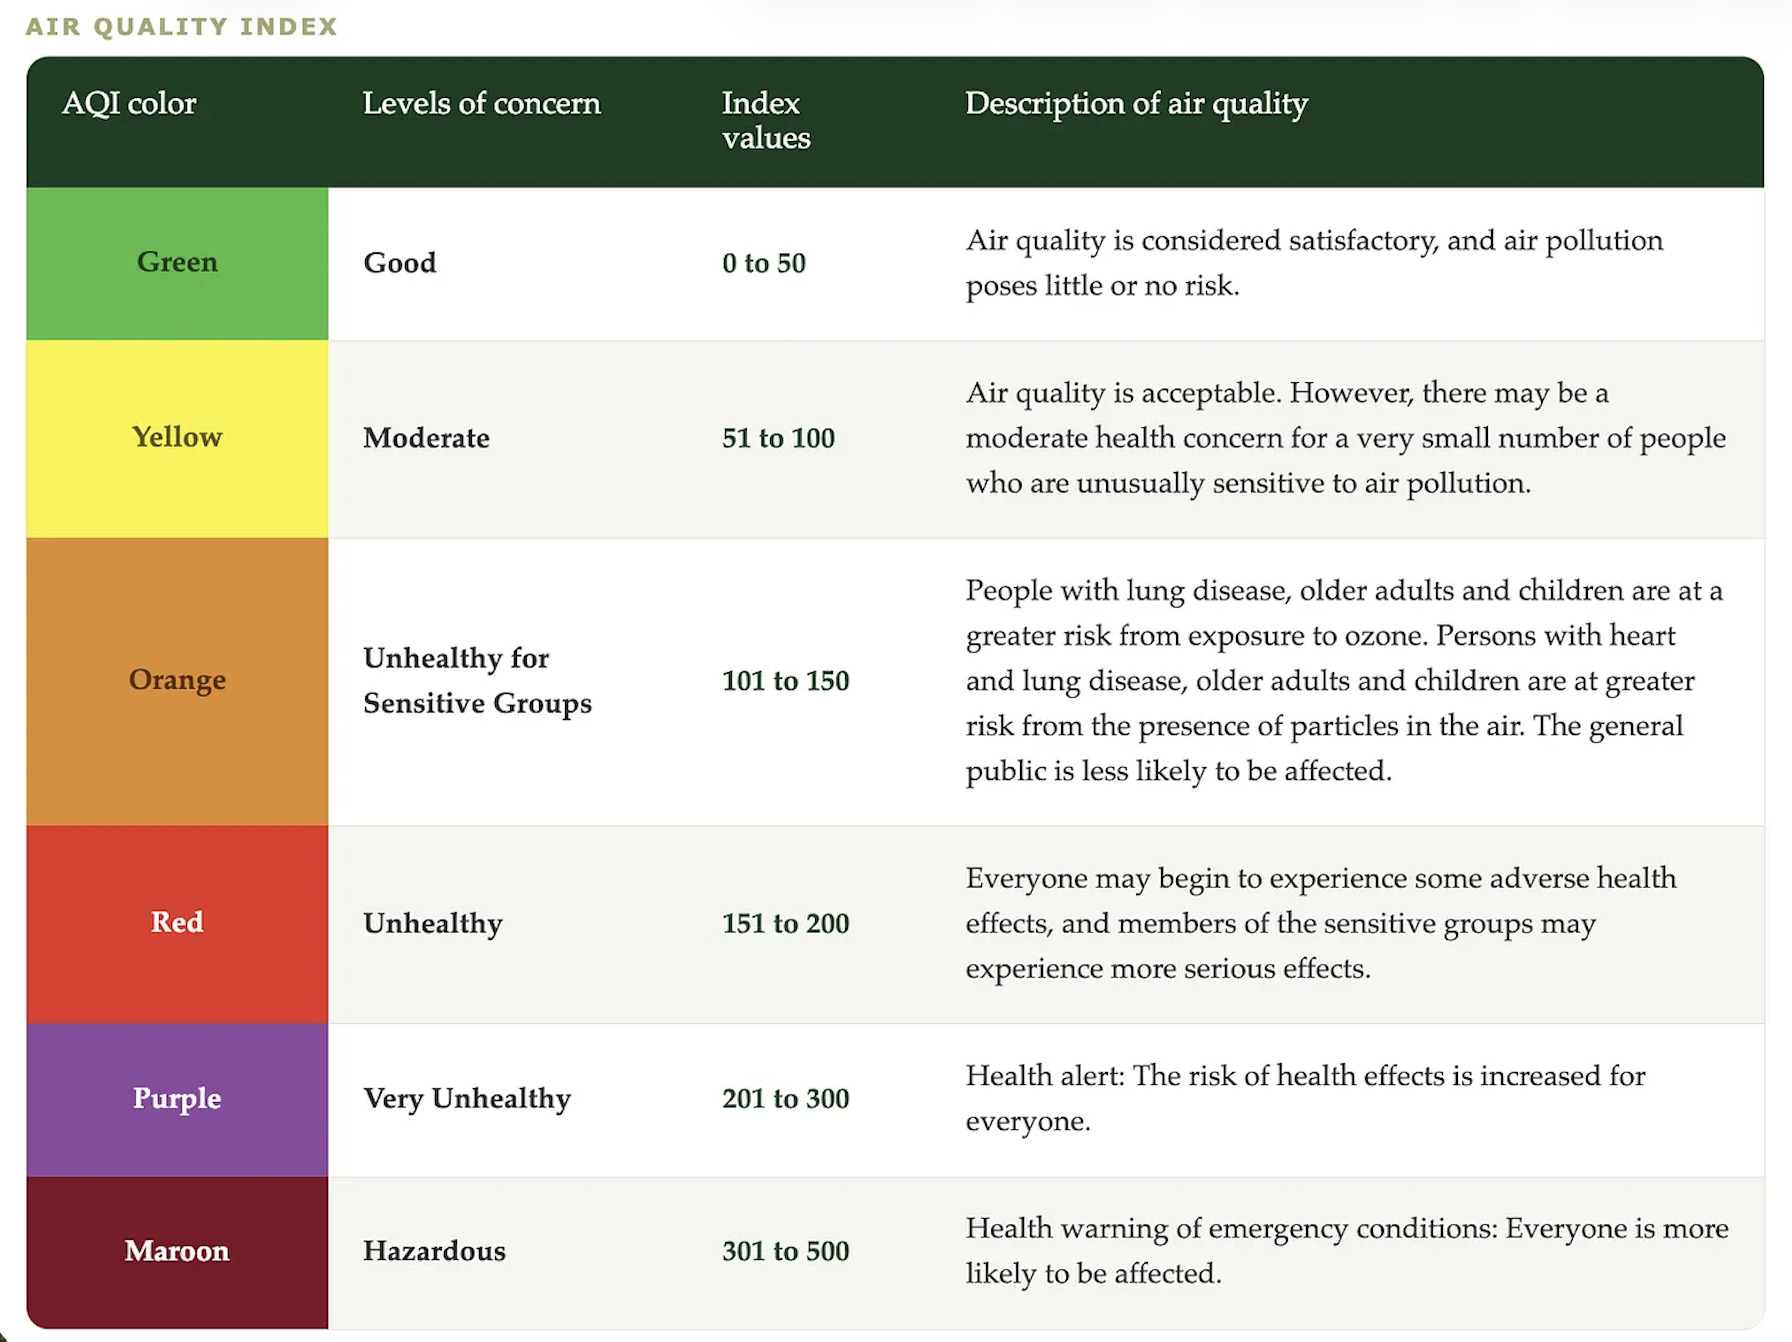
MPCA has the magic number at 101. Once the forecast crosses into orange, they issue an air quality alert.
Where the AQI came from.
This is a fairly young tool. Before 1976, air quality reporting in the U.S. was chaotic. Fifty-five cities used fourteen different indices.
The 1970 Clean Air Act fixed the underlying science by naming six “criteria” pollutants the EPA had to regulate: particulate matter, ground-level ozone, sulfur dioxide, nitrogen dioxide, carbon monoxide, and lead. Then in 1976, the EPA rolled out a national standard called the Pollutant Standards Index, or PSI, so every city would speak the same language.
The PSI ran for a couple of decades. In 1999, the EPA overhauled it, folded in newer standards for fine particles and ozone, gathered input from health experts and eight public focus groups, and renamed it the Air Quality Index. That’s the version we still use, updated every few years as the health science sharpens.
Lead, one of the original six, got dropped from the daily index. Lead poisoning is cumulative and doesn’t show up meaningfully in a same-day report, so it didn’t fit the format.
How the number is actually calculated.
Here’s where most people assume the AQI is just “the pollution level.” It isn’t. It’s a translation.
Minnesota’s AQI comes from hourly measurements of five pollutants: particles (PM10 and PM2.5), ground-level ozone, sulfur dioxide, nitrogen dioxide, and carbon monoxide.
Each one is measured in its own units (micrograms per cubic meter, parts per million, parts per billion), and each gets converted onto that same 0-to-500 scale.
The key rule: the AQI reports only the single worst pollutant. If the PM2.5 score is 310 and the ozone scores a 67, your AQI is 310.
For the nerds.
Because health impacts change at different rates for different pollutants, agencies use a continuous piecewise linear function to map concentrations to AQI.
The EPA sets “breakpoints,” concentration values that mark the edge of each color category, and the formula draws a straight line between the two breakpoints your reading falls between.
I = ((I_high − I_low) / (BP_high − BP_low)) × (C − BP_low) + I_low
Where C is the pollutant concentration your monitor measured, BP_high and BP_low are the breakpoints just above and below it, and I_high and I_low are the AQI values tied to those breakpoints.
A real example. Say a monitor reads 30.0 µg/m³ of fine particles over 24 hours. That lands in the Moderate band, so BP_low is 9.1, BP_high is 35.4, I_low is 51, and I_high is 100. Plug it in: ((100 − 51) / (35.4 − 9.1)) × (30.0 − 9.1) + 51, which works out to about 90 AQI.
The wildfire wrinkle. During a fast-moving smoke event, the standard 24-hour average is useless. If the air went from clean to hazardous in three hours, a 24-hour average would badly understate what you’re breathing right now. So the “current” AQI you see on AirNow uses something called the NowCast, a weighted algorithm that leans heavily on the most recent hours when air quality is changing fast. That’s why the number can swing so much during a day like yesterday.
What this means for your health.
PM2.5 refers to particles 2.5 microns across or smaller, roughly thirty times thinner than a human hair. They’re small enough to slip past your body’s defenses, embed deep into your lungs, and cross into your bloodstream.
In the short term, that shows up as irritated eyes, a scratchy throat, coughing, chest tightness, headache, and fatigue or brain fog. In maroon-level air, the MPCA is blunt: anyone can experience serious heart and lung effects, including asthma attacks, heart attacks, and strokes.
The EPA links short-term PM2.5 and smoke exposure to respiratory and cardiovascular harm and premature death, with emergency-room visits climbing as smoke density rises.
- Smoke exposure may impair your lungs’ ability to clear out viruses and bacteria
- There’s early evidence linking short-term smoke exposure to preterm birth and to measurable dips in cognitive performance
- Even healthy people can get pulmonary inflammation and temporary drops in lung function
Why wildfire smoke is uniquely bad for your health.
Here’s what makes wildfire smoke worse. Smoke is two threats in one.
The first is the fine particles, the PM2.5.
The second is the gases and chemicals released as fires burn vegetation, homes, vehicles, and whatever else is in their path.
Also, you don’t have to see haze to be breathing it. Smoke travels hundreds, sometimes thousands, of miles and can sit high in the atmosphere or dilute enough that the sky looks nearly clear while the AQI is still ugly.
Who feels it first?
Some people feel it first and worst:
- People with asthma, COPD, or other breathing conditions
- People with heart disease, high blood pressure, or diabetes
- Pregnant people
- Children and older adults
And the heat makes it worse. We’re under an excessive heat warning at the same time as this alert, and heat compounds the health toll of poor air.
Let’s take a look at the history of Minnesota’s air.
The chart tells two stories. The baseline keeps getting better (more green), driven by cleaner power plants (coal retirements), cleaner vehicles, and lower industrial emissions, while the extremes are getting worse and more frequent due to climate-driven wildfire activity.
What to do about it.
The playbook during an outdoor wildfire/smoke event is not complicated. It’s mostly about sealing up and filtering.
- Stay inside.
- Keep windows and doors shut.
- Run a HEPA-plus-carbon air purifier continuously. The single most effective thing you can do for your indoor air.
- If you have to go outside, wear a fitted N95 or KN95 mask.
And…
- Don’t add indoor pollution. You already know this one!
- Don’t exercise outside. Hard breathing pulls more smoke deeper into your lungs. Move the workout indoors or skip it.
A resource for the data & air quality nerds.
Beyond the AirNow app on your phone, the MPCA runs an air quality page with current statewide conditions, and its AQI calendar tool is worth a look. It lets you pull up historical AQI by day and region, so you can actually see how a summer like 2025 stacked up against the years before it.
Wishing you clean air and clear skies,
Hunter
We built a bunch of FREE resources for you!
- Take our home health quiz (~5 min)
- View a recent home assessment report
- Try out our indication guide to lead pipes
- See your radon risk with our Minnesota radon map
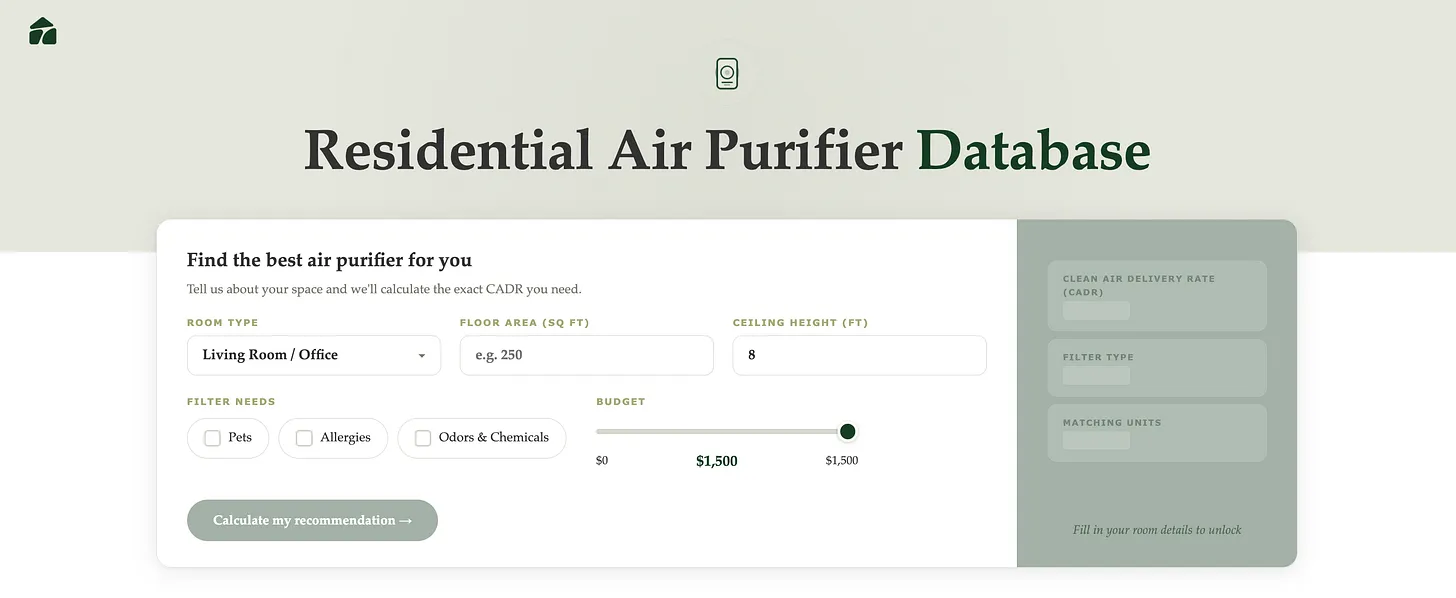
- Calculate what the best air purifier is for your home from our database
- Schedule a free 15 minute chat with our founder about any questions you have